Fragmentomics
CySeq allows you to explore the fragmentomics profile of a cell-free DNA sample.
Note
This section contains example plots and the code used to generate them. This requires the installation of an additional python library that is not included in the default installation of pycyseq.
You can install them in the same virtual environment you have install pycyseq by running:
pip install matplotlib
Single-strand DNA
For the complete API on ssDNA see SingleStrandAligment.
Fragment length
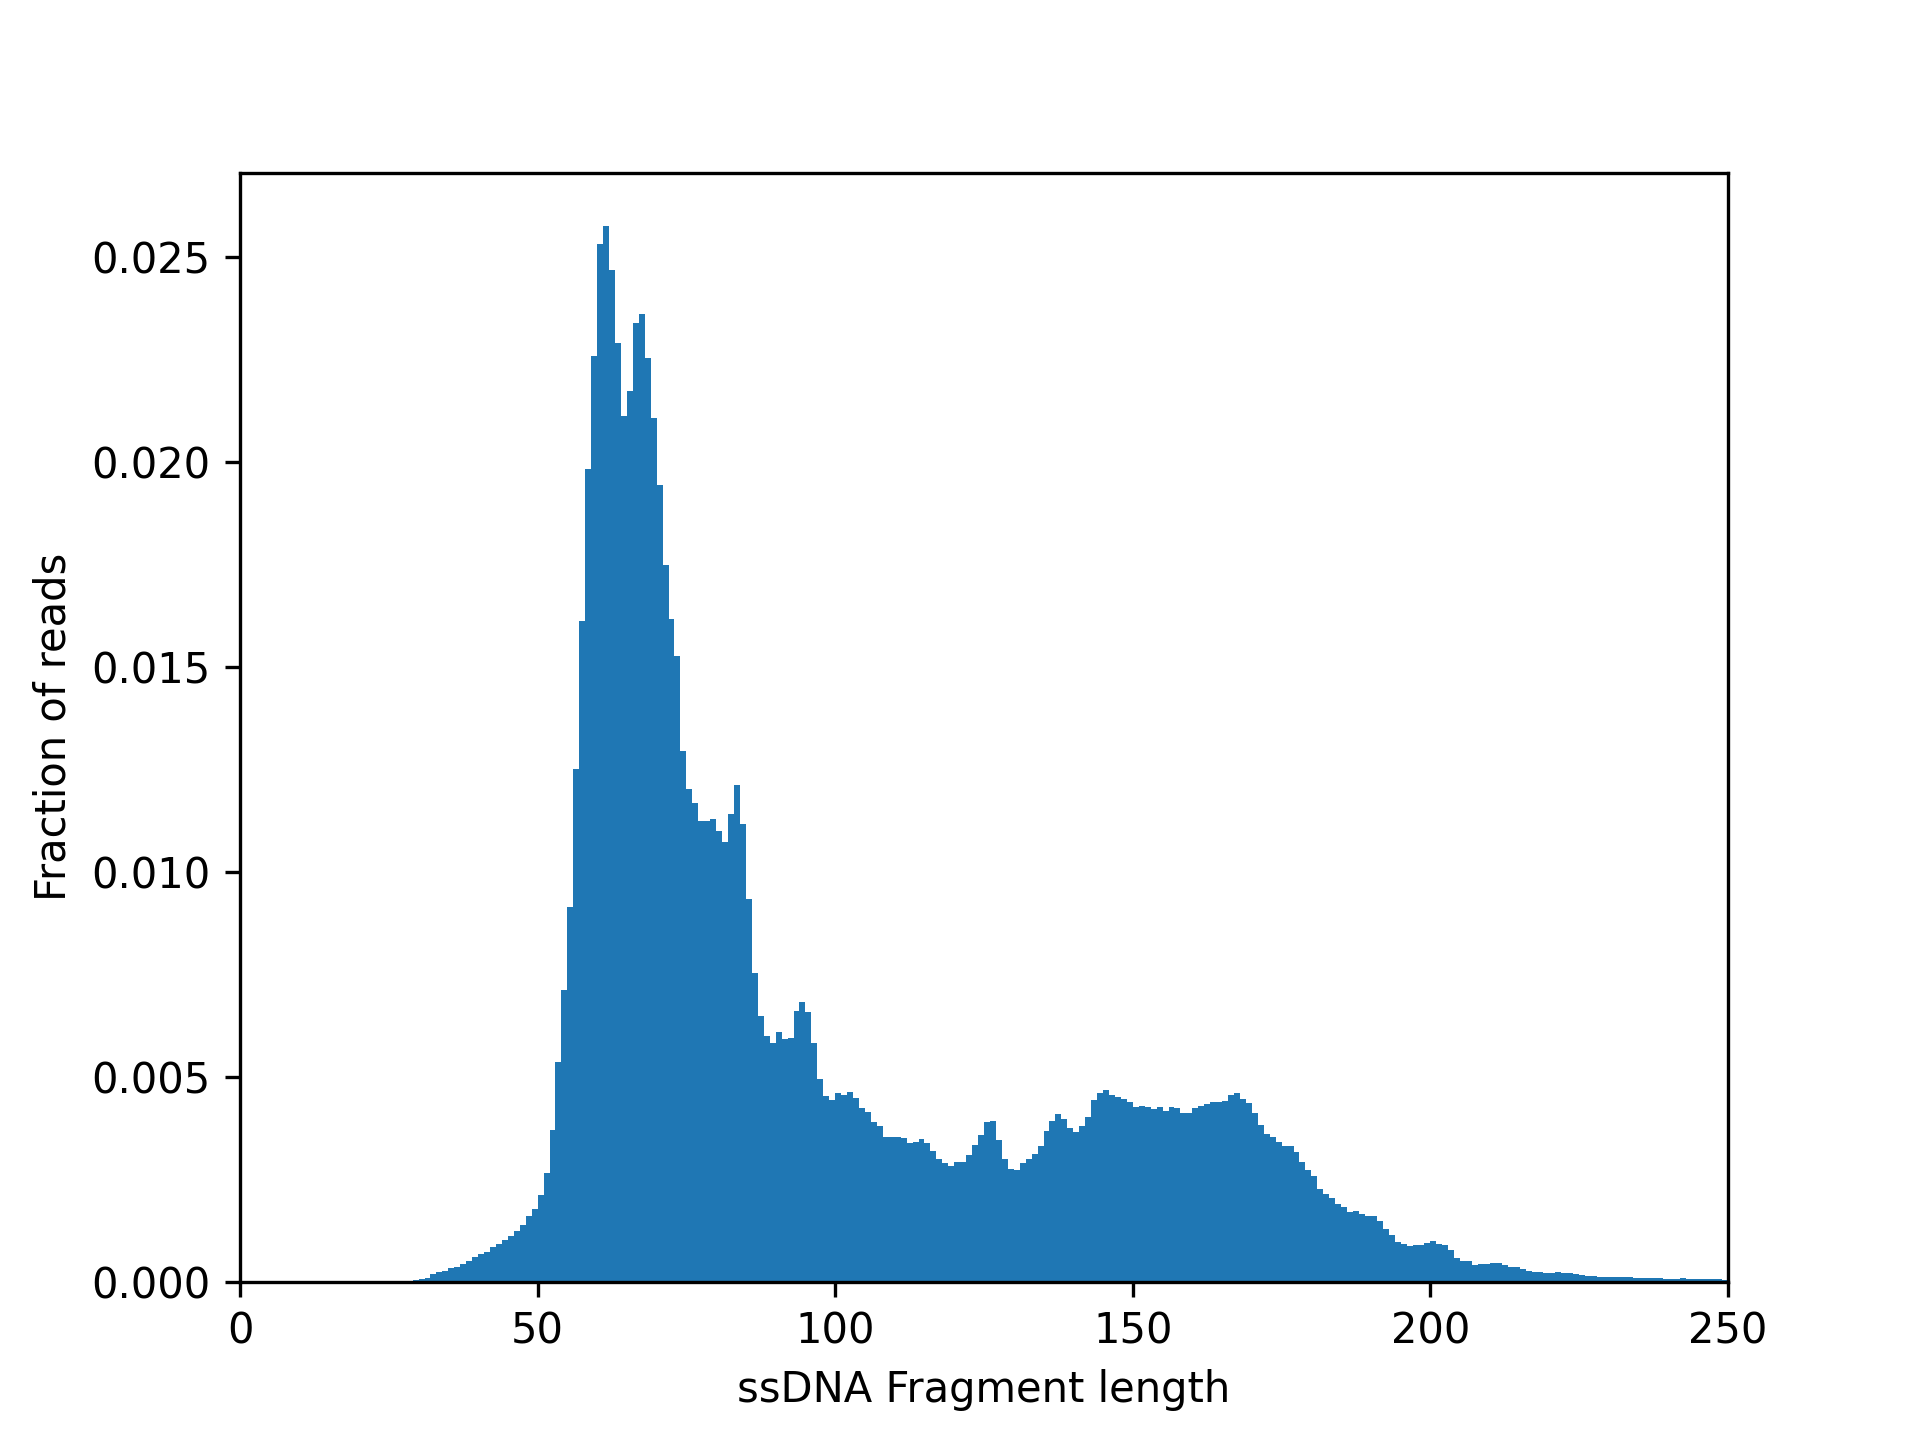
CySeq reads from Single-strand DNA (ssDNA) have single basepair accuracy length, we can therefore investigate the length of ssDNA molecules. The plot below shows the fragment length distribution from cfDNA collected from blood from an individual.
# import the necessary modules
from pycyseq import read_cyseq_alignment_file
from matplotlib import pyplot as plt

# extract the data from the bam file
ssdna_lengths = []
for alignment_group in read_cyseq_alignment_file(BAM_FILE):

    # include only alignments from ssDNA
    if alignment_group.is_ssdna:

        # take only the primary alignment (first), to not double-count cases
        # with supplementary alignments
        aln = alignment_group[0]
        # do not include reads marked as duplicate
        if aln.is_duplicate:
            continue
        ssdna_lengths.append(aln.len)

# make the plot
fig, ax = plt.subplots()

bins = list(range(0, max(ssdna_lengths)))
ax.hist(
    x=ssdna_lengths,
    bins=bins,
    density=True,
)

ax.set_xlim(0, 250)
ax.set_xlabel("ssDNA Fragment length")
ax.set_ylabel("Number of reads")

plt.show()
Double-strand DNA
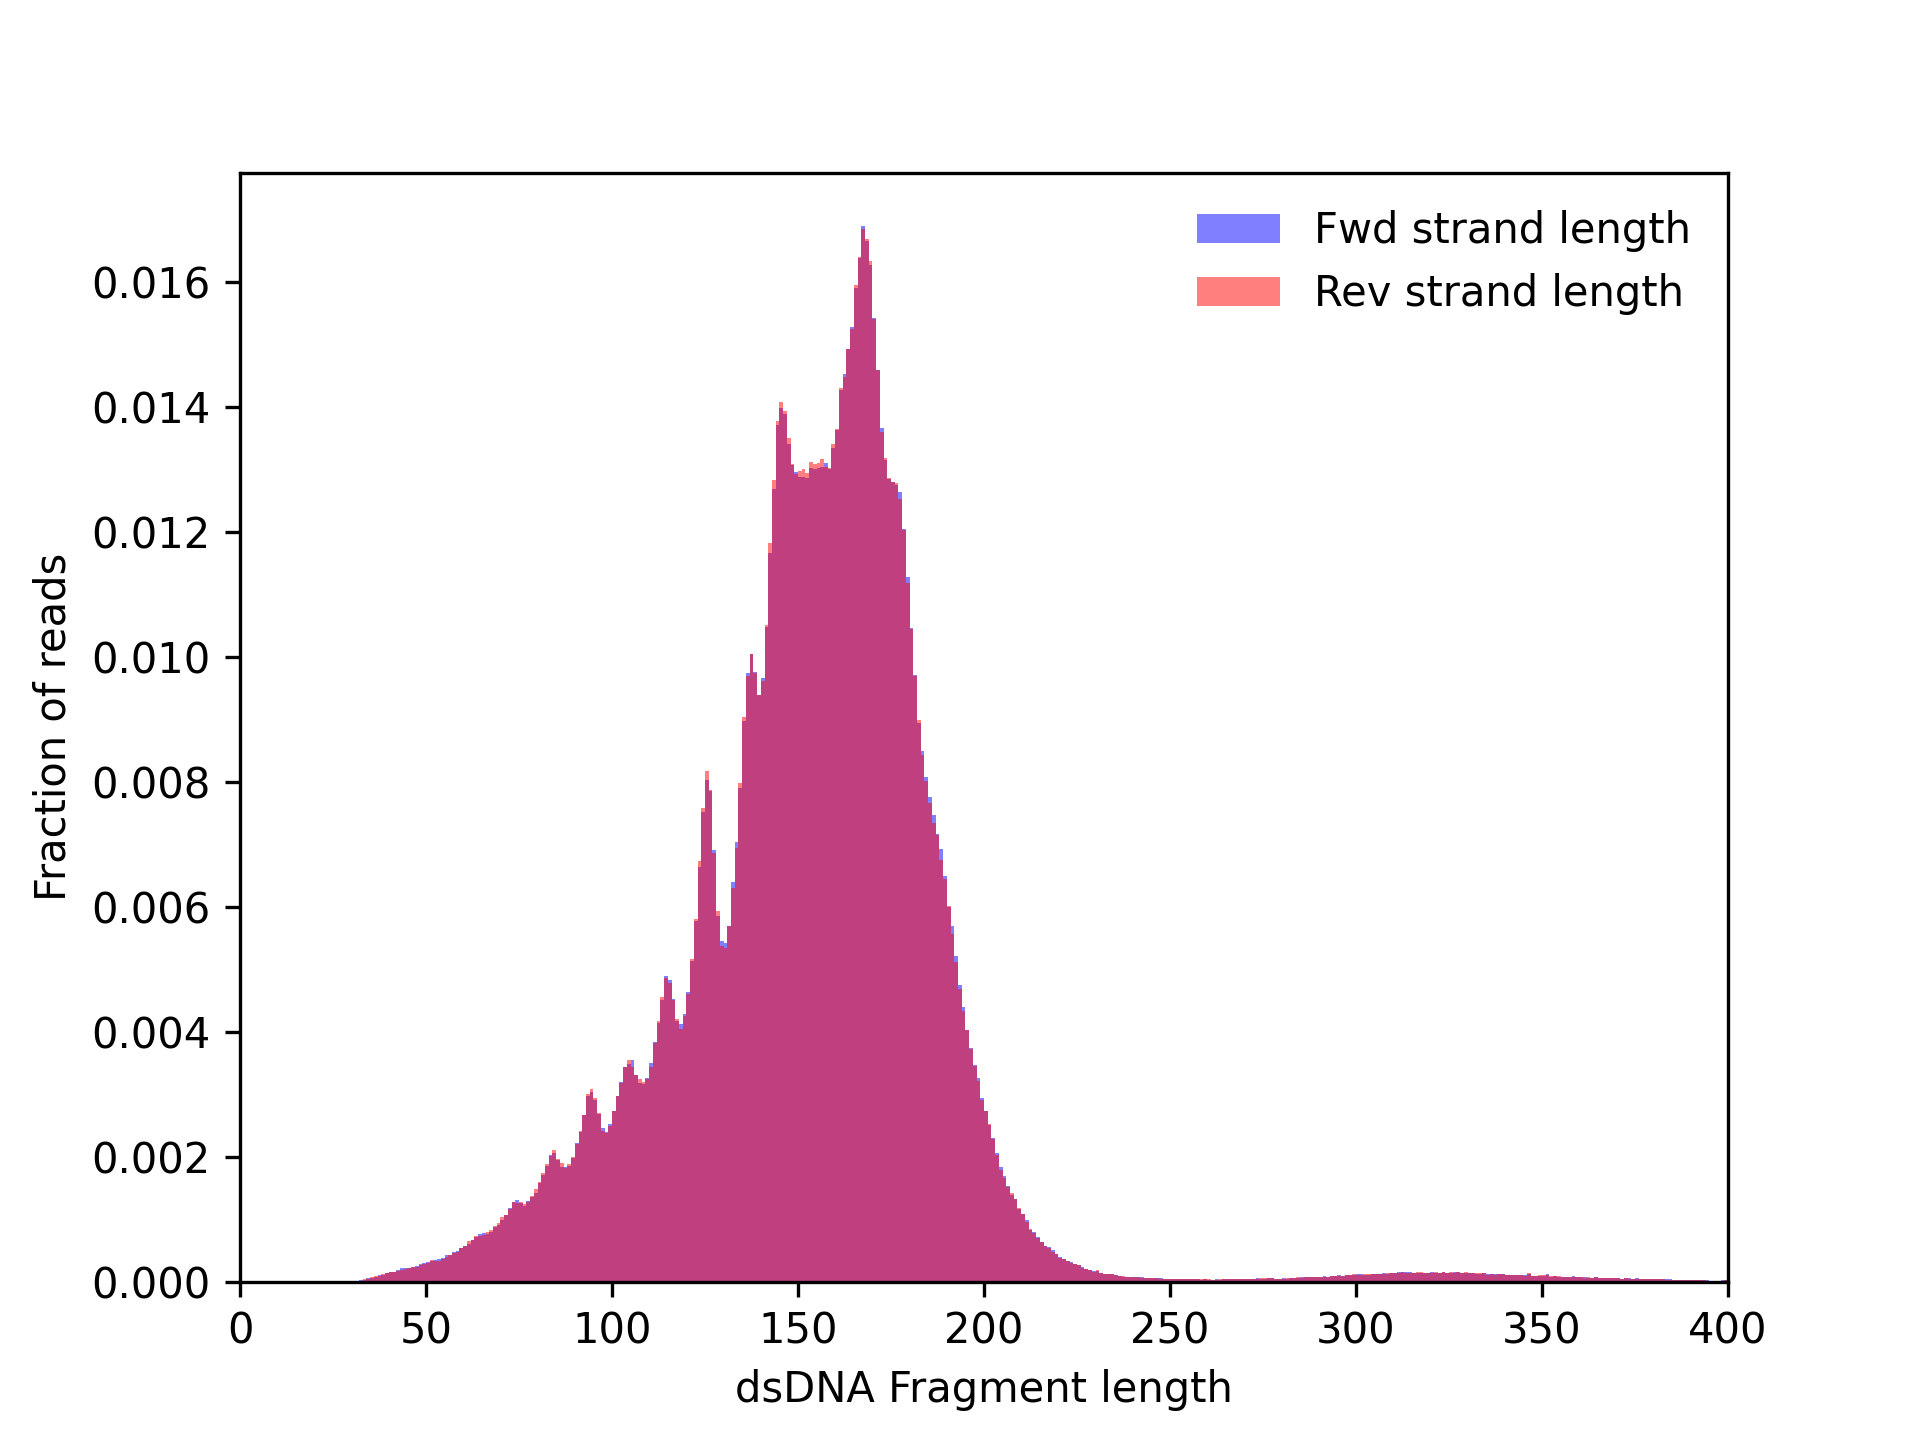
CySeq reads from double-strand DNA (dsDNA) preserve the native overhangs of the molecules. We can investigate where these overhangs are located, the length of the dsDNA molecules, and the length of the overhangs.
For the complete API on dsDNA see DoubleStrandAlignment.
Read types
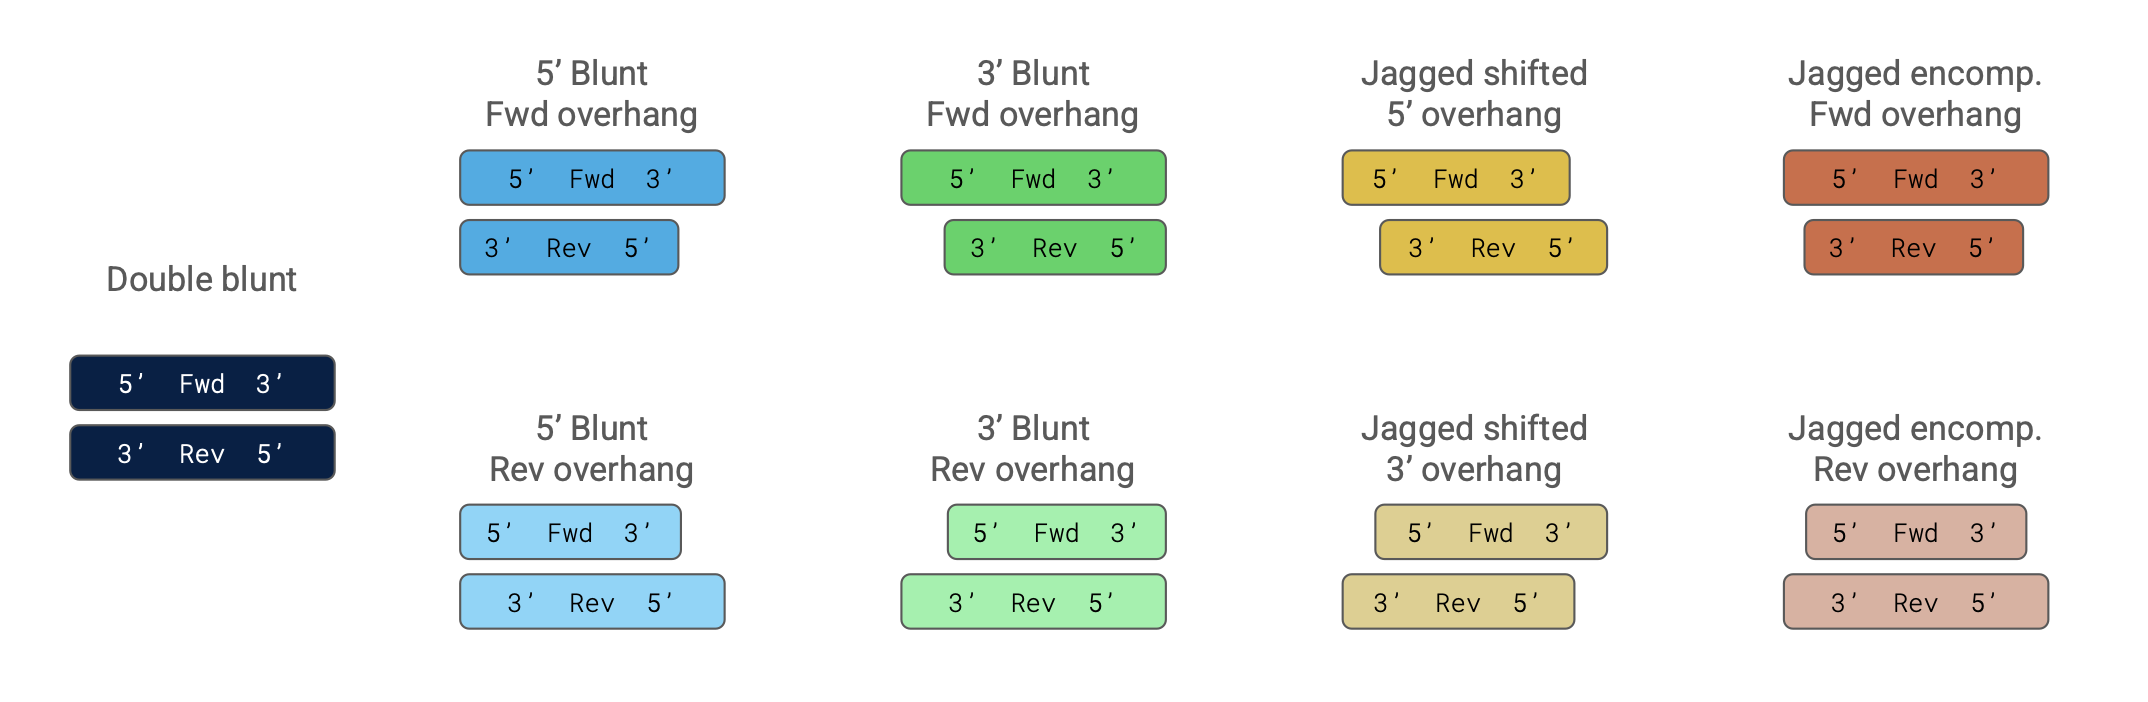
dsDNA can be classified into 9 different types depending on the length and location of the overhangs. The image below shows a visual representation of the 9 different types.
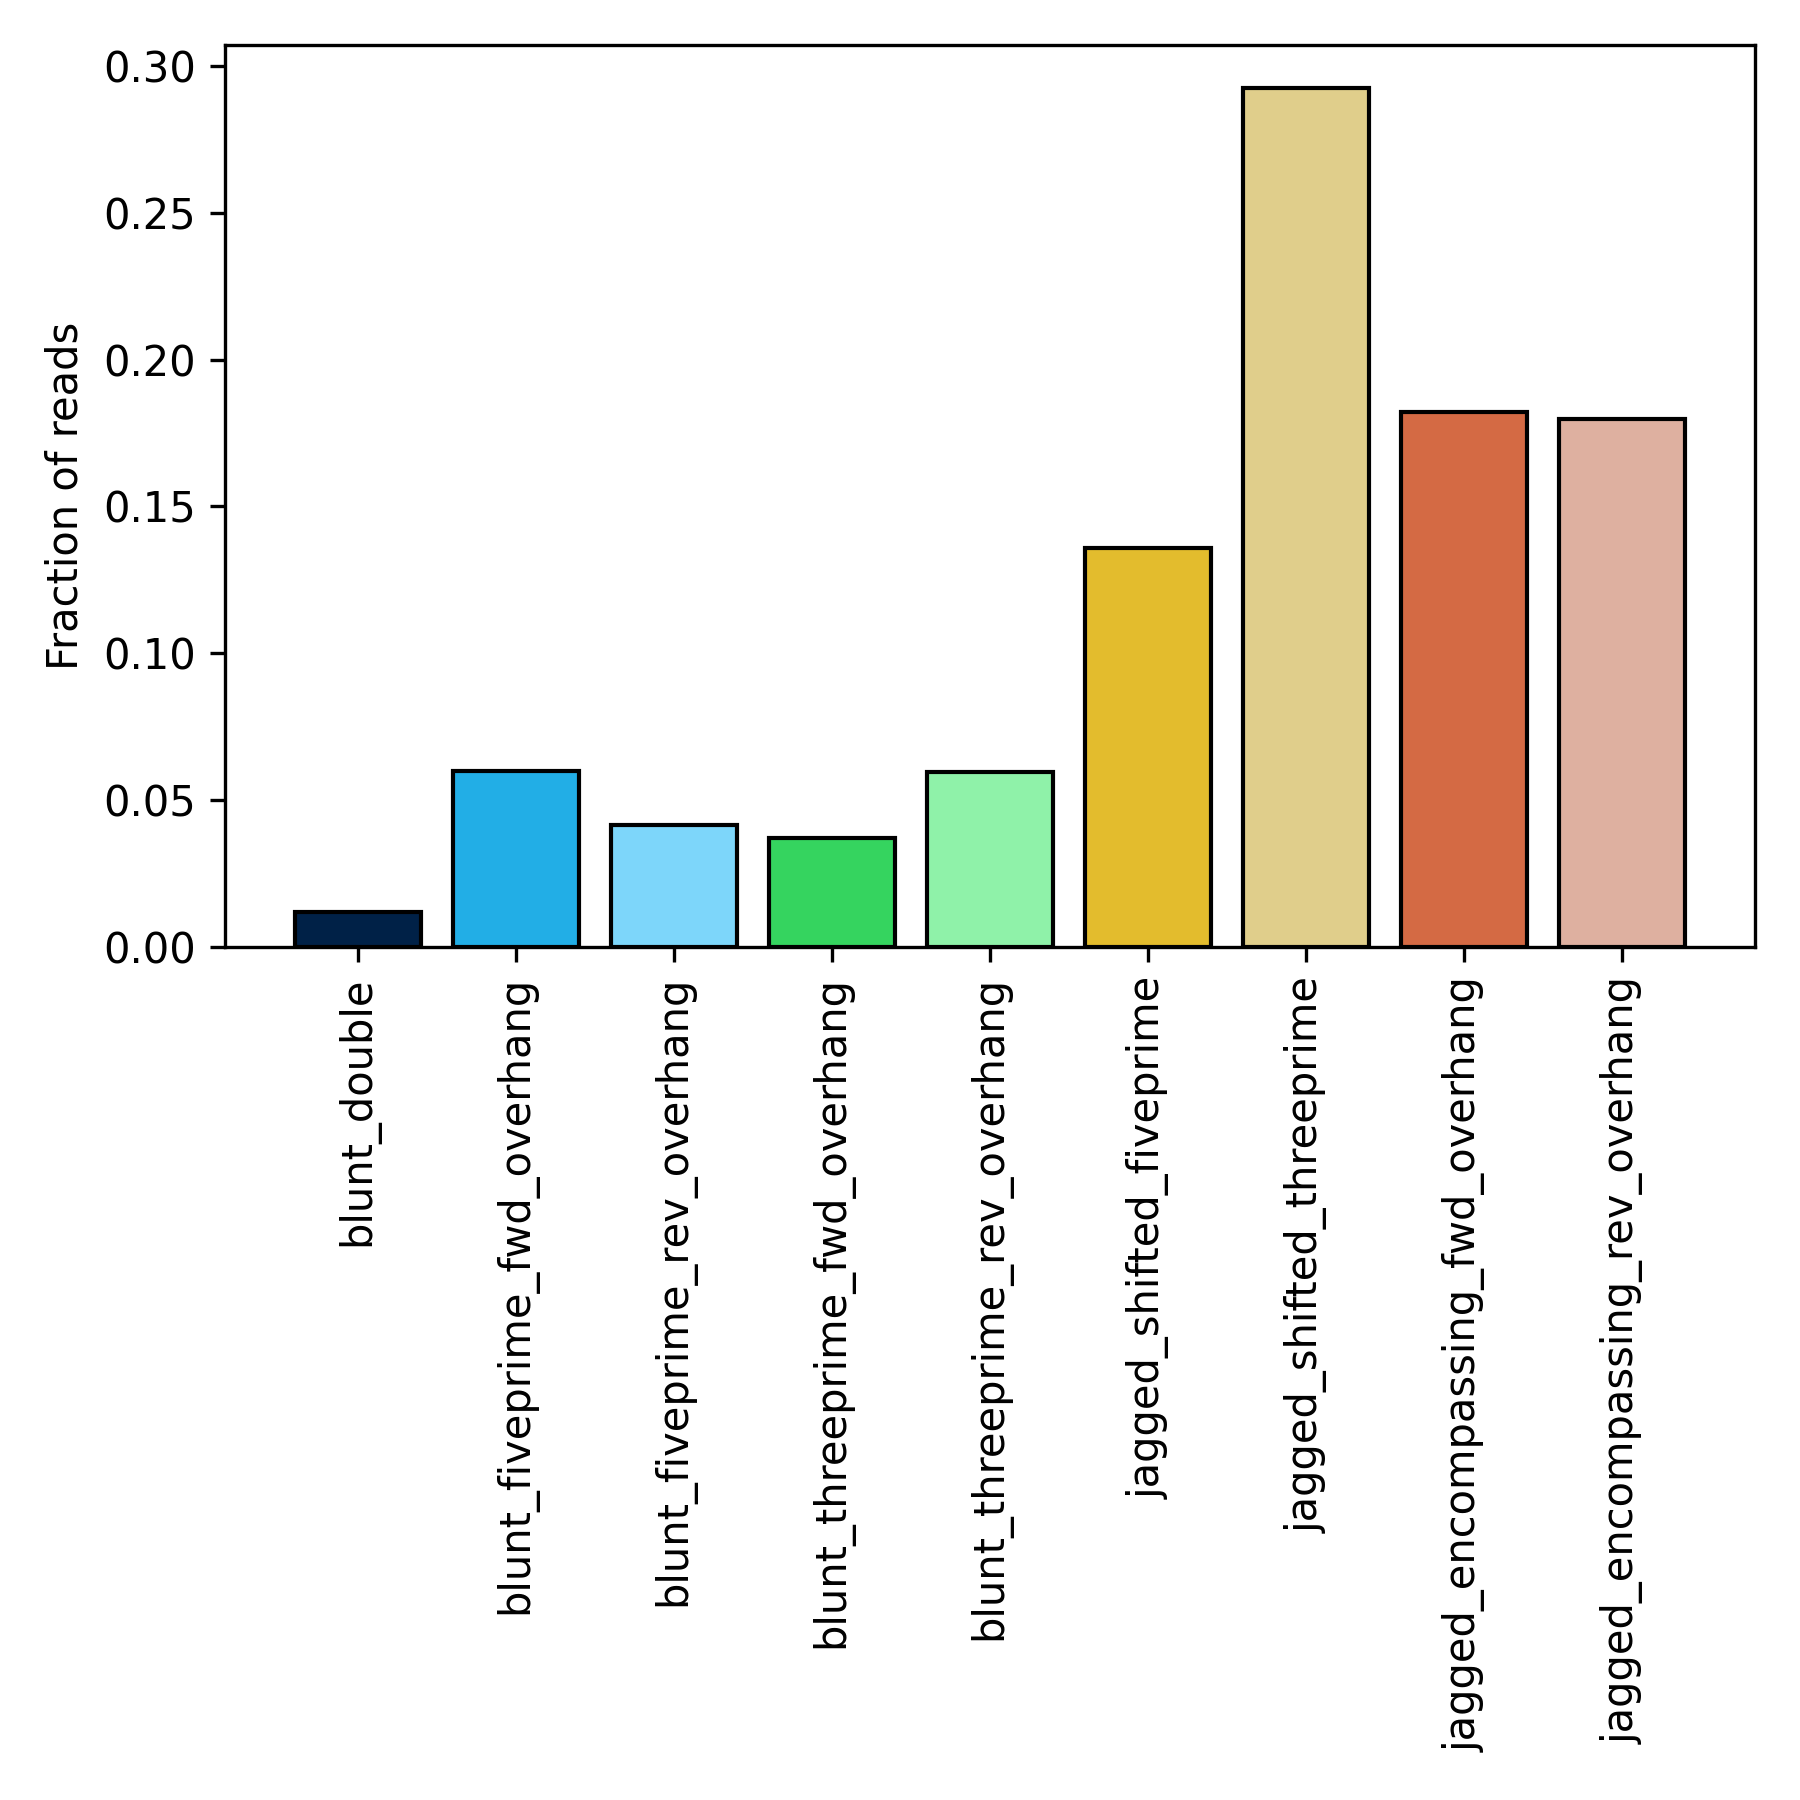
The plot below shows the relative composition of dsDNA types from cfDNA collected from blood from an individual.
# import the necessary modules
from pycyseq import read_cyseq_alignment_file
from matplotlib import pyplot as plt

read_types = {}
for alignment_group in read_cyseq_alignment_file(BAM_FILE):

    # include only alignments from ssDNA
    if alignment_group.is_dsdna:

        if alignment_group.has_rotations:
            continue
        aln = alignment_group[0]
        # do not include reads marked as duplicate
        if aln.is_duplicate:
            continue
        if aln.type not in read_types:
            read_types[aln.type] = 0
        read_types[aln.type] += 1

# make the plot
fig, ax = plt.subplots(figsize=(6, 6))

colors = {
    "blunt_double": "#002147",
    "blunt_fiveprime_fwd_overhang": "#22aee6",
    "blunt_fiveprime_rev_overhang": "#7dd6fa",
    "blunt_threeprime_fwd_overhang": "#35d45f",
    "blunt_threeprime_rev_overhang": "#8ff2a9",
    "jagged_shifted_fiveprime": "#e3bc2d",
    "jagged_shifted_threeprime": "#e0ce8b",
    "jagged_encompassing_fwd_overhang": "#d46a44",
    "jagged_encompassing_rev_overhang": "#deb0a0",
}

total = sum(read_types.values())
for i, (read_type, color) in enumerate(colors.items()):
    ax.bar(
        x=[i],
        height=[read_types[read_type]/total],
        color=color,
        edgecolor="black"
    )

ax.set_xticks(list(range(len(colors))))
ax.set_xticklabels(list(colors.keys()), rotation=90)
ax.set_ylabel("Fraction of reads")

fig.tight_layout()

plt.show()
Fragment length
# import the necessary modules
from pycyseq import read_cyseq_alignment_file
from matplotlib import pyplot as plt

# extract the data from the bam file
dsdna_fwd_lengths = []
dsdna_rev_lengths = []
for alignment_group in read_cyseq_alignment_file(BAM_FILE):

    # include only alignments from ssDNA
    if alignment_group.is_dsdna:

        # exclude cases where more than one possible rotation exists
        if alignment_group.has_rotations:
            continue

        aln = alignment_group[0]

        # do not include reads marked as duplicate
        if aln.is_duplicate:
            continue

        dsdna_fwd_lengths.append(aln.len_fwd)
        dsdna_rev_lengths.append(aln.len_rev)

# make the plot
fig, ax = plt.subplots()

bins = list(range(0, max(dsdna_fwd_lengths)))
ax.hist(
    x=dsdna_fwd_lengths,
    bins=bins,
    alpha=0.5,
    color="blue",
    label="Fwd strand length",
    density=True,
)

ax.hist(
    x=dsdna_rev_lengths,
    bins=bins,
    alpha=0.5,
    color="red",
    label="Rev strand length",
    density=True,
)

ax.set_xlim(0, 400)
ax.set_xlabel("dsDNA Fragment length")
ax.set_ylabel("Fraction of reads")
ax.legend(frameon=False, loc="upper right")

plt.show()